What is nonparametric statistics? What are five commonly used nonparametric tests, and when do you use them? This article provides answers to these questions and links to published studies using nonparametric tests.
Table of Contents
Introduction
Nonparametric statistics offers alternative solutions to data analysis in many situations where parametric statistics are not applicable. As pointed out earlier in my previous post on nonparametric tests, the primary consideration is when the data distribution is not normal. Its use is also justified in times where you do not know or have difficulty knowing the population’s distribution. You can safely infer from the data without knowing the underlying distribution.
If parametric tests are applied to analyze sampling data that are not normally distributed or approximate a bell-shaped curve, erroneous conclusions result. Once you contribute findings based on inappropriate use of parametric tests, you will mislead other researchers who will cite unwittingly cite your paper as a basis.
What is nonparametric statistics?
Nonparametric statistics refers to statistical techniques that do not rely on data belonging to any particular distribution, whether these data are normally distributed or not. That is why they are called distribution-free methods.
Nonparametric statistics are called distribution-free data analysis techniques because it uses rank-ordered data instead of the variables’ actual measurements. Hence, nonparametric statistics is sometimes called rank statistics.
It looks into the median, not the mean, in finding out differences or correlations between the population samples. In non-normal distributions, the mean is a better approximation of the “center” or representative of the sample distribution.
Five Commonly Used Nonparametric Statistics and Their Selection
Statisticians have developed many nonparametric statistics techniques but for students who do not pursue statistics as a specialization, knowing all of them is overkill. Thus, for practical purposes, I will only enumerate five commonly used nonparametric tests.
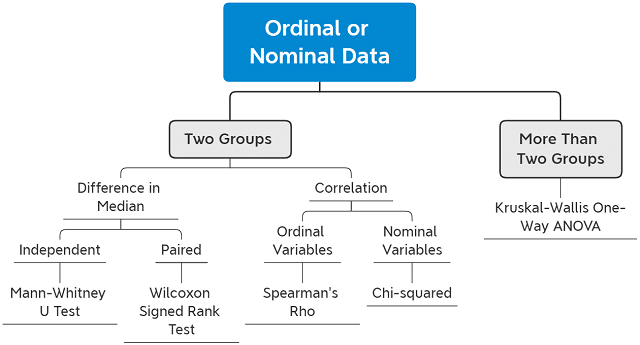
The figure below shows an overview of the five commonly used nonparametric tests for two groups and more than two groups of samples. These tests correspond to the five parametric tests I listed in my previous post on eight considerations when using nonparametric tests.

Mann-Whitney U Test (or Wilcoxon Rank Sum Test, Mann Whitney Wilcoxon Test)
Mann-Whitney U- Test corresponds to the independent samples t-test. The test is used when testing two independent samples that contain ordinal data. It compares the medians between the two populations.
The null and alternative hypotheses for the nonparametric tests are:
H0: The two populations are equal versus
H1: The two populations are not equal.
Example Study Applying Mann Whitney U Test
Shih et al. (2006) determined that there is no difference in environmental awareness and cognizance of environmental auditing between internal auditors in the manufacturing industry and those in the service industry.
Wilcoxon Signed Rank Test
Wilcoxon Signed Rank Test is the counterpart of the paired samples t-test. It tests whether matched pairs or two dependent samples with ordinal data. Further, it analyzes the signs of the differences as well as the magnitude of the observed differences.
Example Study Applying Wilcoxon Signed Rank Test
Dettmann-Easler and Pease (1999) examined 6 residential programs to evaluate their effectiveness in fostering attitude toward wildlife.
Spearman Rho
Spearman Rho is the counterpart test of Pearson’s Product Moment Correlation Coefficient or simply Pearson‘s r. This nonparametric test is used when you want to find a correlation between two groups of data. Use when you want to find a correlation between two sets of data.
Example Study Applying Spearman Rho
Buchanan et al. (2011) analyzed the relationship between blood lead levels (PbB) and distortion product otoacoustic emissions (DPOAE) amplitude.
Kruskal-Wallis Test
Kruskal-Wallis Test is the counterpart nonparametric test of One-Way Analysis of Variance (ANOVA). Hence, it compares more than two independent groups using the medians of the groups being compared. It is an ANOVA that uses ranks instead of means.
The null and alternative hypotheses for the Kruskal Wallis nonparametric test are:
H0: The k population medians are equal versus
H1: The k population medians are not all equal
Example Study Applying Kruskal-Wallis Test
Saenz-Arroyo, et al. (2005) compared the perception of three generations of fishers on how they perceive the state of the abundance or size of fish species.
Chi-Squared test
The Chi-squared test (χ2) is considered a nonparametric test, although it does not use ranks in analyzing data. T-tests whether two nominal variables are associated or significantly correlated. It uses frequencies that intersect two nominal or categorical variables bounding the longitudinal and horizontal rows. The two groups must be independent of each other, meaning they were not paired together during data collection.
The χ2 test tests whether the proportion of samples with or without a particular characteristic differs between two or more independent groups. It compares expected with observed frequencies.
For the Chi-squared test to give reliable results, the value of each cell’s expected values should be 5 or more in at least 80% of the cells, and no cell should have an expected value of less than one.
Example Study Applying Chi-squared Test
Sudarmadi et al. (2001) investigated the differences in perception, knowledge, awareness, and attitude to environmental problems between educated and community groups.
References
Buchanan, L. H., Counter, S. A., & Ortega, F. (2011). Environmental lead exposure and otoacoustic emissions in Andean children. Journal of Toxicology and Environmental Health, Part A, 74(19), 1280-1293.
Dettmann-Easler, D., & Pease, J. L. (1999). Evaluating the effectiveness of residential environmental education programs in fostering positive attitudes toward wildlife. The Journal of Environmental Education, 31(1), 33-39.
Saenz-Arroyo, A., Roberts, C., Torre, J., Cariño-Olvera, M., & Enríquez-Andrade, R. (2005). Rapidly shifting environmental baselines among fishers of the Gulf of California. Proceedings of the Royal Society B: Biological Sciences, 272(1575), 1957-1962.
Shih, K. H., Chen, H. J., & Chen, J. C. (2006). Assessment of sustainable development and knowledge of environmental management. Industrial Management & Data Systems.
Sudarmadi, S., Suzuki, S., Kawada, T., Netti, H., Soemantri, S., & Tugaswati, A. T. (2001). A survey of perception, knowledge, awareness, and attitude in regard to environmental problems in a sample of two different social groups in Jakarta, Indonesia. Environment, development and sustainability, 3(2), 169-183.
© 2020 October 12 P. A. Regoniel
[cite]


