Are you in need of a free spreadsheet software that works like Excel? Gnumeric is just what you need. It is a powerful, free statistical spreadsheet software that will help you analyze data just like Excel’s Analysis ToolPak. Here is a demonstration of what it can do.
Many of the statistical software applications available today in the windows platform are for sale. Some companies do offer free spreadsheet software, but those could not perform complex data analysis.
Do you know that there is free statistical software that can analyze your data? It works like MS Excel. Enter Gnumeric 1.12.50, the latest release in 2021.
I compare the output of these two spreadsheet software applications, the MS Excel output using its complex statistics add-in called Analysis Toolpak and Gnumeric with a tutorial on how to use it. I compared two groups of data using a t-test.
Gnumeric: Free Spreadsheet Software
I discovered Gnumeric in 2014 while searching for statistical software application that will work in my Ubuntu Linux distribution, Ubuntu 12.04 LTS, which I enjoyed using for almost two years. The spreadsheet software still works as it used to even up to this time. Gnumeric thrived through the years, unlike other free software applications developed for Linux that die a natural death when there are no more volunteers or passionate Linux users who work on it.
I encountered Gnumeric while looking for an open-source statistical software that works like the Data Analysis add-in of MS Excel. My purpose was to gather the best software applications for my exclusive collection of Linux office productivity tools.
I landed on a forum talking about alternatives for MS Excel’s data analysis add-in. In that forum, a student lamented that he can’t afford to buy MS Excel. He was in a quandary because his professor uses MS Excel’s Data Analysis add-in to solve statistical problems. He asked for an alternative to MS Excel. Not just a cheap software application but a free one at that.
A reader in that forum who happened to be a professor himself recommended Gnumeric.
Generally, computer users avoid using free spreadsheet software in Linux because they lack features found in purchased products that they are familiar with while using windows applications. But given the subscription-based offering of Microsoft in its line of products as any profit-oriented company would do, many windows users have gradually shifted their eyes towards open-source alternatives. That includes me, although I still keep my windows laptop for compatibility reasons.
Many of my co-workers stick with windows software applications as they find Linux challenging to learn. I continue using the Windows operating system to cater to my colleagues’ convenience and to save time. I avoid spending time on document conversion from Linux to Windows compatible files. If my colleagues use the editing features of MS word and we exchange notes on MS Word, I have no choice but to use a windows operating system.
Another feature that Windows users avoid using free spreadsheet software applications is that these are lacking in features found in purchased products. This situation makes sense because Linux software applications are labors of love by a community of developers. Many of them voluntarily spend time to improve open-source software application development projects. More people are needed to improve many of the features of Linux applications.
However, as any Linux software application does, Gnumeric has evolved and improved much through the years based on reviews. Now, it works and produces statistical output like MS Excel’s Data Analysis add-in.
Activating the Data Analysis Function
I described earlier how the complex data analysis function of Microsoft Excel add-in is activated and used in comparing two groups of data, specifically, the use of t-test. In Microsoft Office 365, an online version of MS Excel uses a different data analysis tool. It is a more intuitive one, perhaps using an AI to discern what the user needs. I will explain how this works later in my upcoming post.
For die-hard fans of Linux and open-source software applications like me, you can install Gnumeric in your Ubuntu, Mint, Suse, and other Linux distributions right off the bat. This open-source, free spreadsheet software works as expected, without spending an arm and a leg. That’s what I discovered when I installed the free software using Ubuntu’s Software Center.
So here’s a tutorial for newbies on this very effective spreadsheet software that works like Excel’s complex Data Analysis Toolpak.
Analyzing Heart Rate Data Using Gnumeric
I tried Gnumeric in analyzing the same set of data on heart rate that I analyzed using MS Excel in the Analysis ToolPak article I wrote earlier. I copied the data from MS Excel and pasted them into the Gnumeric spreadsheet.
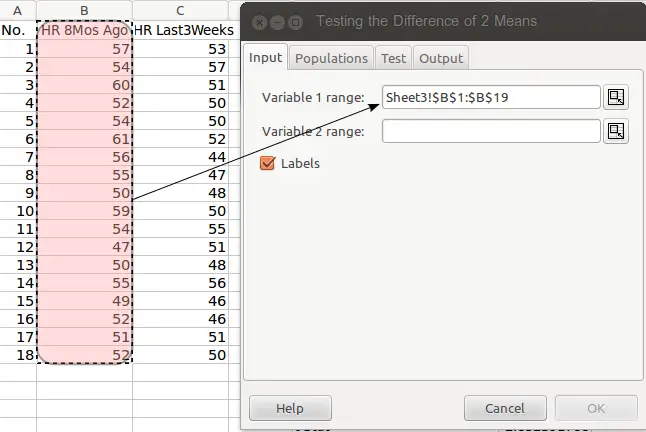
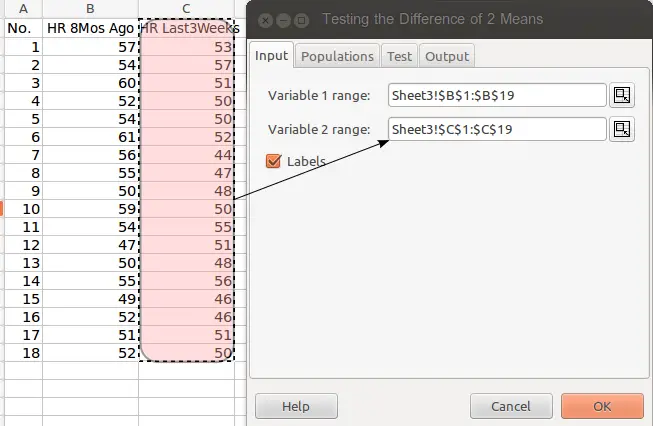
To analyze data, go to the menu, click on Statistics, select the column of the two groups one at a time including the label and input them in separate fields. Then click the Label box. If you click the Label box, you are telling the computer to use the first row as the Label of your groups.
In the t-test analysis that I employed using Gnumeric, I labeled one group as HR 8 months ago for heart rate eight months ago and another group as HR Last 3weeks as samples for my heart rate for the last six weeks.
t-test Menu in Gnumeric Spreadsheet 1.10.17
The t-test function in Gnumeric can be accessed in the menu by clicking on the Statistics menu. Here’s a screenshot of the menus to click for a t-test analysis (Fig. 1).

Notice that the Unpaired Samples, Equal Variances: T-test … was selected.
In my earlier post on t-test using MS Excel, the F-test revealed that there is no significant difference in variance in both groups so t-test assuming equal variances is the appropriate analysis.


Data Analysis Output of Gnumeric and MS Excel Analysis Toolpak
After you have input the data in Variable 1 and Variable 2 fields, click on the Output tab. You may just leave the Populations and Test tabs at default settings. Choose the cell in the spreadsheet where you want the output to be displayed.
Here’s the output of the data analysis using t-test in Gnumeric compared to that obtained using MS Excel (click to enlarge):

Notice that the output of the analysis using MS Excel and Gnumeric are essentially the same. In fact, Gnumeric provides more details although MS Excel has a visible title and formally formatted table for the F-test and t-test analysis.
Since both software applications deliver the same results, your sensible choice is to install the free software Gnumeric to help you solve statistical problems.
You can avail of the latest stable release if you have installed a Linux distribution in your computer.
If you want to create high quality graphs for publication using Gnumeric, the following detailed tutorial will guide you on how to do it. Find the portion that works for you.
Gnumeric is a wonderful and free spreadsheet software that can help you fulfill your course requirements in Statistics.
Try it and see how it works. You may download the latest stable release for your version of operating system in the Gnumeric homepage. That’s Gnumeric 1.12.50, the latest release in 2021.
Please note that Gnumeric at this time supports Linux distribution only. But you can always install Linux in your windows laptop using Oracle’s VirtualBox. Make a quick install in your windows computer and enjoy this free spreadsheet software.
© 2014 May 3 P. A. Regoniel, Updated: 27 November 2021


