Table of Contents
Is there a way to simplify the preparation of your research or thesis proposal without leaving out the important components?
Yes! This article introduces the research proposal matrix, a practical tool that provides four systematic steps to help you write your research proposal with clarity and confidence.
Many students struggle with writing and rewriting their thesis proposals because they miss important details. Preparing a research or thesis proposal is time-consuming and stressful, especially when you’re working within a tight timeframe.
If you want your proposal approved faster so you can move on to data collection, the matrix approach can save you time and effort.
Why Use a Research Proposal Matrix?
A research proposal matrix is a table that allows you to align your research questions, methodology, and statistical analysis. This systematic approach ensures that your study is well-structured and that every part of your proposal connects logically.
When I introduce this technique to my students, many are unfamiliar with the term “matrix” outside of the movie title. To clarify, a matrix is simply a table with rows and columns. It serves as a roadmap that helps you focus, organize your ideas, and prevent unnecessary revisions.
Four Steps to Write Your Research Proposal Using a Matrix
1. Prepare a Table
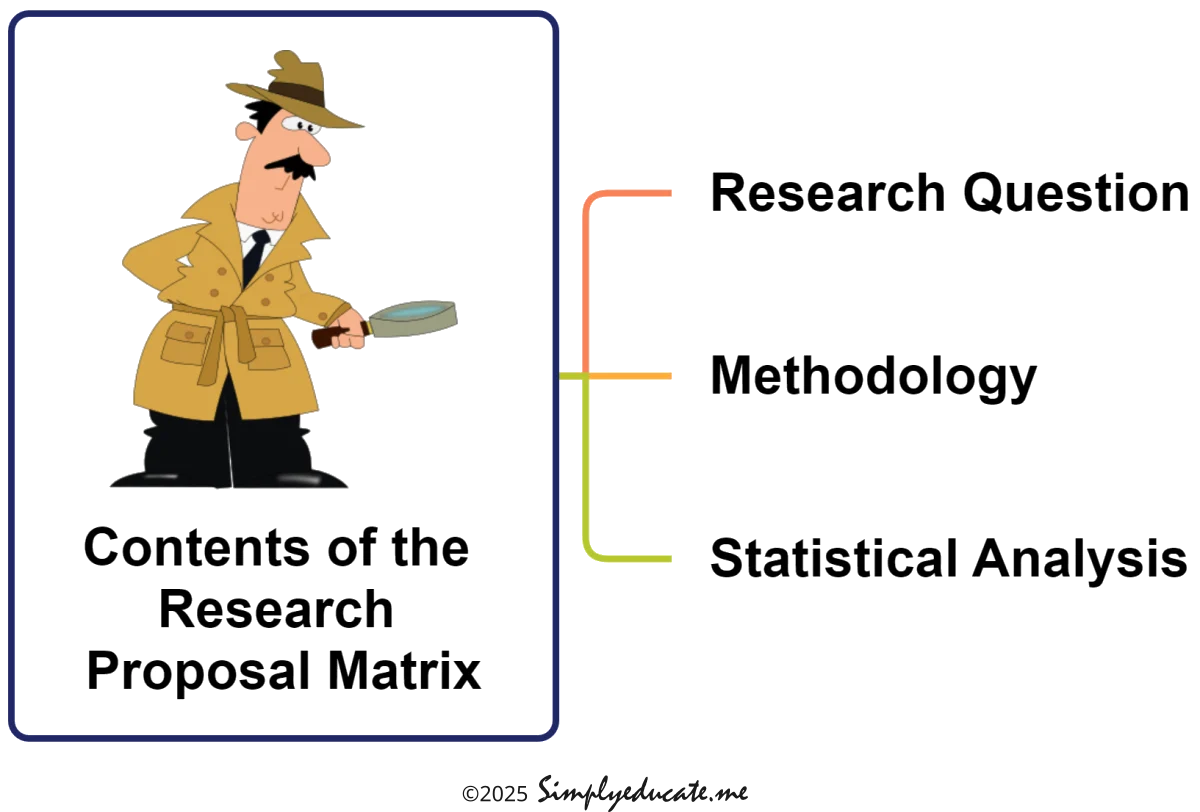
Draw a table with three columns labeled:
- Research Question
- Methodology
- Statistical Analysis
You may use a sheet of paper, spreadsheet software, or a word processor to create this table.
2. List the Research Questions
Under the Research Question column, write down your research questions in logical order. Logical order means that the answer to the first question will naturally lead to the next.
3. Identify the Methods
In the Methodology column, specify the methods you will use to answer each research question. This could include surveys, interviews, experiments, or field observations. Be specific about what data you will collect and how.
4. Select the Appropriate Statistical Tools
In the Statistical Analysis column, list the statistical methods you will apply to analyze your data. Examples include:
- Descriptive statistics (mean, median, mode, percentages)
- Correlation analysis
- T-test or ANOVA
- Multivariate analysis
You may also note the graphs or tables you plan to use for presenting your findings.
Example of a Research Proposal Matrix
For instance, if your research topic is illegal fishing, the matrix might look like this:
| Research Question | Methodology | Statistical Analysis |
|---|---|---|
| 1. What are the demographic characteristics of the illegal fishers? a. age b. gender c. civil status d. number of children e. educational attainment | Questionnaire Guided interview Personal observation | Descriptive statistics (mean, standard deviation, frequency, percentage) |
| 2. What fishing methods do fishers undertake? a. use of dynamite in fishing b. cyanide use in collecting aquarium fishes c. use of fine-sized mesh nets d. overturn corals using crowbars e. hook-and-line fishing f. spear fishing | Questionnaire Government agency records Research project records Personal observation Focus group discussion Photodocumentation | Frequency Percentage |
| 3. Is there a relationship between demographic characteristics and percentage of illegal fishing practices committed by the fishers? | Questionnaire Key informant interview Focus group discussion | Multivariate analysis (e.g. multiple regression analysis) |
| 4. What are the benefits and costs of illegal fishing? | Economic analysis | Net Present Value |
| 5. How effective are existing policies against illegal fishing? | Policy review and key informant interviews | Comparative analysis (chi-square, t-test) |
You may expand the contents of the research proposal matrix if you prefer like including the hypotheses, expected outcomes, and timeline. But this lean research proposal matrix will easily capture what you have in mind before going into details.
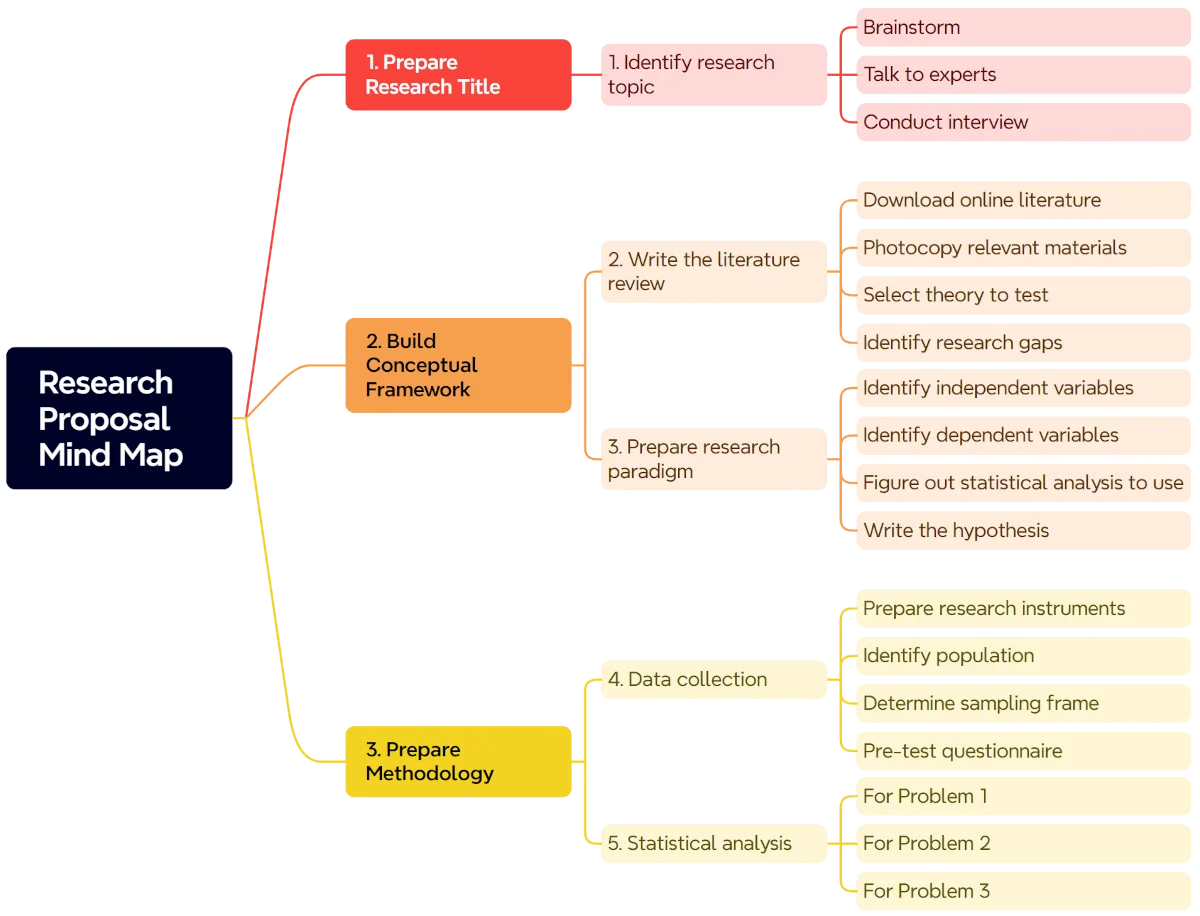
A more detailed guide on the specific contents can be found in the mind map below.

Final Step: Align with the Conceptual Framework
Before finalizing your proposal, check whether the variables in your matrix align with your conceptual framework. If they don’t, revise your proposal accordingly. This ensures consistency between your research design and theoretical foundation.
Conclusion
The research proposal matrix is a simple yet powerful tool that can make writing your thesis or dissertation proposal much easier. By following these four steps, you can systematically organize your ideas, reduce revisions, and confidently present a well-prepared research proposal.
FAQ
Q1: What is a research proposal matrix?
A research proposal matrix is a table that aligns your research questions, methodology, and statistical analysis to ensure a systematic and well-structured research proposal.
Q2: Why should I use a research proposal matrix?
It helps prevent missed details, reduces the need for multiple revisions, and ensures consistency between your research questions and methods.
Q3: What are the steps in creating a research proposal matrix?
- Create a table with three columns.
- List your research questions in logical order.
- Identify the methods for answering each question.
- Select appropriate statistical tools for data analysis.
Q4: Can the research proposal matrix be used for any field of study?
Yes, the matrix approach is flexible and can be applied to various disciplines, including social sciences, natural sciences, engineering, and education.

