Are you in need of a statistical software but cannot afford to buy one? Gnumeric is just what you need. It is a powerful, free statistical software that will help you analyze data just like a paid one. Here is a demonstration of what it can do.
Many of the statistical softwares available today in the windows platform are for sale. But do you know that there is a free statistical software that can analyze your data as well as those which require you to purchase the product? Gnumeric is the answer.
Gnumeric: A Free Alternative to MS Excel’s Data Analysis Add-in
I discovered Gnumeric while searching for a statistical software that will work in my Ubuntu Linux distribution, Ubuntu 12.04 LTS, which I enjoyed using for almost two years. I encountered it while looking for an open source statistical software that will work like the Data Analysis add-in of MS Excel.
I browsed a forum about alternatives for MS Excel’s data analysis add-in. In that forum, a student lamented that he cannot afford to buy MS Excel but was in a quandary because his professor uses MS Excel’s Data Analysis add-in to solve statistical problems. A professor recommended Gnumeric in response to a student’s query in a forum about alternatives to MS Excel. Not just a cheap alternative but a free one at that.I described earlier how the Data Analysis function of Microsoft Excel add-in is activated and used in comparing two groups of data, specifically, the use of t-test.
One of the reasons why computer users avoid the use of free softwares such as Gnumeric is that these are lacking in features found in purchased products. But as what happens to any Linux software application, Gnumeric has evolved and improved much through the years based on the reviews I read. It works and produces statistical output just like MS Excel’s Data Analysis add-in. That’s what I discovered when I installed the free software using Ubuntu’s Software Center.
Analyzing Heart Rate Data Using Gnumeric
I tried Gnumeric in analyzing the same set of data on heart rate that I analyzed using MS Excel in the post before this one. I copied the data from MS Excel and pasted them into the Gnumeric spreadsheet.
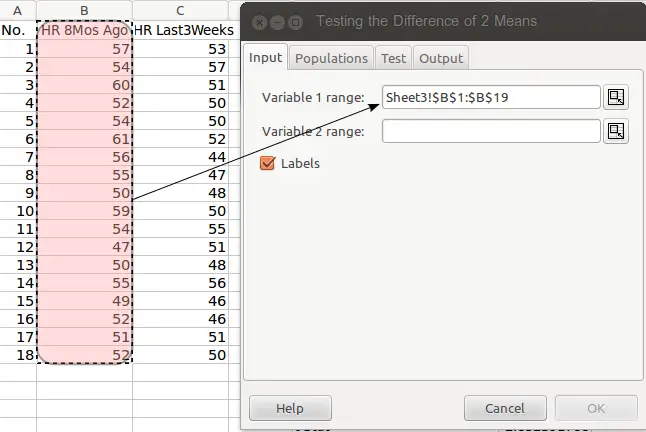
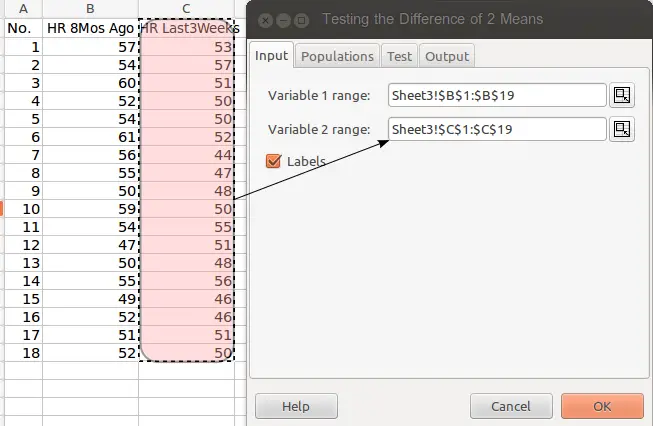
To analyze the data, you just have to go to the menu, click on Statistics, select the column of the two groups one at a time including the label and input them in separate fields. Then click the Label box. If you click the Label box, you are telling the computer to use the first row as Label of your groups (see Figs. 1-3 below for a graphic guide).
In the t-test analysis that I employed using Gnumeric, I labeled one group as HR 8 months ago for heart rate eight months ago and another group as HR Last 3weeks as samples for my heart rate for the last six weeks.
t-test Menu in Gnumeric Spreadsheet 1.10.17
The t-test function in Gnumeric can be accessed in the menu by clicking on the Statistics menu. Here’s a screenshot of the menus to click for a t-test analysis.

Notice that the Unpaired Samples, Equal Variances: T-test … was selected. In my earlier post on t-test using MS Excel, the F-test revealed that there is no significant difference in variance in both groups so t-test assuming equal variances is the appropriate analysis.


- Fig. 3. Highlighting variable 2 column inputs the range of values for analysis.
After you have input the data in Variable 1 and Variable 2 fields, click on the Output tab. You may just leave the Populations and Test tabs at default settings. Just select the cell in the spreadsheet where you want the output to be displayed.
Here’s the output of the data analysis using t-test in Gnumeric compared to that obtained using MS Excel (click to enlarge):

 Fig. 4. Gnumeric and MS Excel output.
Notice that the output of the analysis using MS Excel and Gnumeric are essentially the same. In fact, Gnumeric provides more details although MS Excel has a visible title and formally formatted table for the F-test and t-test analysis.
Since both software applications deliver the same results, your sensible choice is to install the free software Gnumeric to help you solve statistical problems. You can avail of the latest stable release if you have installed a Linux distribution in your computer.
Try it and see how it works. You may download the latest stable release for your version of operating system in the Gnumeric homepage.
© 2014 May 3 P. A. Regoniel


