What is parametric statistics and when do you use them? Here are four widely used parametric tests and tips on when to use them. Read on to find out.
Parametric statistics involve the use of parameters to describe a population. For example, the population mean is a parameter, while the sample mean is a statistic (Chin, 2008). When you use a parametric test, the distribution of values obtained through sampling approximates a normal distribution of values, a “bell-shaped curve” or a Gaussian distribution.
Table of Contents
Why Parametric Tests are Powerful than NonParametric Tests
Generally, parametric tests are considered more powerful than nonparametric tests. They require a smaller sample size than nonparametric tests. But parametric tests are also 95% as powerful as parametric tests when it comes to highlighting the peculiarities or “weirdness” of non-normal populations (Chin, 2008).
If you doubt the data distribution, it will help if you review previous studies about that particular variable you are interested in.
Examples of Widely Used Parametric Tests
Examples of widely used parametric tests include the paired and unpaired t-test, Pearson’s product-moment correlation, Analysis of Variance (ANOVA), and multiple regression. These tests have their counterpart non-parametric tests, which are applied when there is uncertainty or skewness in the distribution of populations under study.
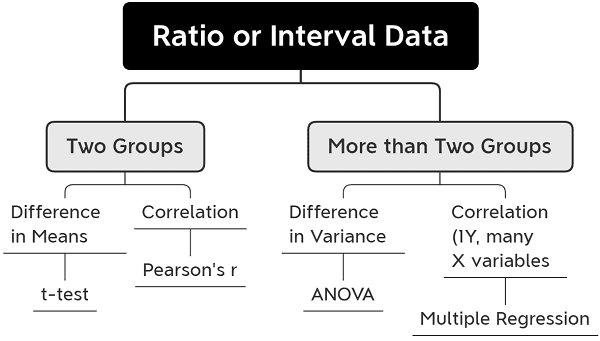
At this digital age, we already have statistical software applications available for use in analyzing our data. Hence, the critical item to learn in this module is to discern when the use of particular parametric tests is appropriate. The diagram in Figure 1 shows under what situations a specific statistical test is used when dealing with ratio or interval data to simplify the choice of a statistical test.

t-test
Student’s t-test is used when comparing the difference in means between two groups. The data obtained from the two groups may be paired or unpaired. A paired t-test is used when we are interested in finding out the difference between two variables for the same subject. On the other hand, an unpaired t-test compares the difference in means of two independent groups to determine if there is a significant difference between the two.
Example
A scientist observed that the coronavirus that spread in India appears to be less virulent than the virus strain in the United States. You would want to compare how long a person recovers from COVID-19 infection between countries. Thus, you can compare the number of days people in India recover from the disease compared to those living in the United States. In this situation, you may use the t-test.
Pearson’s Product Moment Correlation
The Pearson product-moment correlation coefficient or Pearson’s r is a measure of the association’s strength and direction between two variables. The coefficient ranges from 0 to 1. The nearer the value to 1, the higher the correlation. If you see a value of 1 after your computation, that means there’s something wrong with your data or analysis.
Example
A researcher wants to determine the correlation between dissolved oxygen (DO) and the level of nutrients.
Analysis of Variance (ANOVA)
An ANOVA test is another parametric test to use when testing more than two groups to find out if there is a difference between them. It uses the variance among groups of samples to find out if they belong to the same population.
ANOVA is simply an extension of the t-test. It tests whether the averages of the two groups are the same or not.
Example
In the previous example of recovery from virus infection, we can add Italy as another group. Hence, there are three groups to compare. ANOVA may test whether there is a difference in the number of recovery days among the three groups of populations: Indians, Italians, and Americans.
Multiple Regression
Multiple regression is used when we want to predict a dependent variable (Y) based on the value of two or more other variables (Xs). The variable to predict is called the dependent variable. It is often used in coming up with models.
Example
A researcher wants to determine the relationship between temperature, light, water, nutrients, and height of the plant. The height of the plant is the dependent variable. The rest are independent variables.
Reference
Chin, R., & Lee, B. Y. (2008). Principles and practice of clinical trial medicine. Elsevier.
© 2020 September 19 P. A. Regoniel
[cite]

