This article discusses a heart rate t-test analysis using MS Excel Analysis ToolPak add-in. It includes a tutorial on how to install this handy tool integrated into MS Excel. The author used actual data obtained in a personally applied aerobics training program.
Do you know that there resides a powerful statistical software application in the ubiquitous spreadsheet software you use every day or most of the time? If you have installed Microsoft Excel on your computer, chances are, you have not activated a handy add-in: the Data Analysis ToolPak.
This article will guide you on how to install the handy add-in with a supplemental instructional video. See how MS Excel’s data analysis function helped me analyze heartbeat data to discover the effect of aerobic training on my health.
Excel Analysis ToolPak in MS Excel
The Data Analysis Toolpak in MS Excel sits right there for your disposal when faced with an assignment in statistics, data to analyze in the office, or personal use to understand things that matter to you. All of these uses apply to me.
To make use of this nifty tool that the not-so-discerning fail to discover, you will need to install it as an Add-in to your existing MS Excel installation. Ensure that you have placed your original MS Office DVD in your DVD drive upon doing the next steps.
You may also try activating the Analysis Toolpak of MS Excel if your windows computer comes as a package upon laptop or desktop purchase. It will automatically install if the necessary files come with the computer. If not, contact your seller.
You can activate the Data Analysis ToolPak by following the procedure below (this could vary between versions of MS Excel; this one’s for MS Office 2007) or view the video tutorial detailing the steps on how to install it.
- Open MS Excel,
- Click on the Office Button (that round thing at the uppermost left of the spreadsheet),
- Look for the Excel Options menu at the bottom right of the box and click it,
- Choose Add-ins at the left menu,
- Click on the line Analysis ToolPak,
- Choose Excel Add-in in the Manage field below left, then hit Go,
- Check the Analysis ToolPak box, and
- Click Ok.
You should now see the Data Analysis function at the extreme right of your Data menu in your spreadsheet. You are now ready to use it.
Using the Data Analysis ToolPak to Analyze Heart Rate Data
This statistical analysis aims to test whether there is a significant difference in my heart rate eight months ago and last week.
In my earlier post titled How to Slow Down Your Heart Rate Through Aerobics, I mentioned that my heart rate is getting slower over time because of aerobics training. Exercise strengthens the heart muscle. Thus many athletes have lower resting heart beats per minute than non-athletes.
In that article, I used the graphical method to plot a trend line. I did not test whether there is a significant difference in my heart rate, from the time I started measuring my heart rate compared to the last six weeks’ data.
Now, I would like to answer the statistical research question I formulated below:
Statistical Question: Is there a significant difference in heart rate eight months ago and last six weeks’ record?
I will use the Student’s t-test to analyze 18 readings taken eight months ago and the last six weeks as data for comparison. I measured my heart rate upon waking up (measuring at this time ensures that I am well rested) during each of my three-times a week aerobics sessions.
Why 18 weeks of heart rate data?
According to Dr. Kenneth Cooper, the aerobic training effect could be achieved within six weeks. Thus, I thought my heart rate within six weeks should not change significantly. So that’s six weeks times three equals 18 readings.
I figured out eight months would be a sufficient time to effect heart rate change. I started aerobic running eight months ago. And the trend line in the graph I previously presented shows that my heart rate slows down through time.
These are the assumptions of this t-test analysis and the reason for choosing the sample size.
The Importance of an F-test
Before applying the t-test, the first test you should do to avoid a spurious or false conclusion is to test whether the two groups of data have a different variance. Does one group of data vary more than the other?
If they do, then you should not use the t-test. Nonparametric statistical tests such as the Mann-Whitney U test should be used instead.
How do you make sure that this may not be the case, that is, that one group of data varies more than the other? The appropriate test to use is an F-test. If no significant difference is detected, then you can go ahead with the t-test.
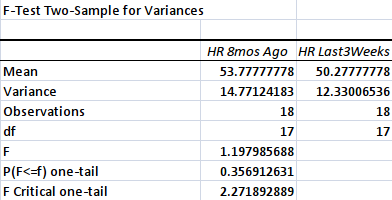
Here’s an output of the F-test using the Analysis ToolPak of MS Excel:

 Fig. 1. F-test analysis using the Analysis ToolPak.
Notice that the p-value for the test is 0.36 [from P(F<=f) one-tail]. This output means that one group of data does not vary more than the other.
How do you know that the difference in variance in the two groups of data using the F-test analysis is not significant? Just look at the p-value of the data analysis output and see whether it is equal to or below 0.05. If it is 0.06 or higher, then the difference in variance is not significant. Given the results of the analysis, I can use the t-test.
This result signals me to go on with the t-test analysis. Notice that the mean heart rate during the last six weeks (i.e., 50.28) is lower than that obtained six months ago (i.e., 53.78). Is this significant?
Result of the t-test
I had run a consistent 30-points per week last August and September 2013. But during the last six weeks, I have accumulated at least 50 points per week. This result means that I almost doubled my capacity to run. And I should have a significantly lower heart rate than before.
I felt that I can still run more than my usual 4 miles. I did run more than 6 miles once a week for the last six weeks.
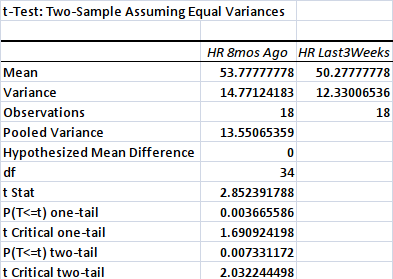
Below is the output of the t-test analysis using the Analysis ToolPak of MS Excel:

The data shows a significant difference between my heart rate eight months ago and the last three weeks. Why? That’s because the p-value is lower than 0.05 [i.e., P(T<=t) two-tail = 0.0073]. There’s a remote possibility that there is no difference in heart rate eight months ago and the last six weeks.
I ignored the other p-value because it is one-tail. I just tested whether there is a significant difference or not. But because the p-value in one-tail is also significant, I can confidently say that indeed I have obtained sufficient evidence that aerobics training had slowed down my heart rate, from 54 to 50.
I have reduced my heart rate in eight months? That’s amazing. I wonder what will be the lowest heart rate I could achieve with constant training.
This finding applies only to me as I used my set of data. It is possible, however, that my findings will apply to everyone.
© 2014 April 28 P. A. Regoniel
Updated: 16 November 2021


