Updated | September 30, 2025
Table of Contents
Data analysis is only as good as the quality of data obtained during the data collection process. This article enumerates the five essential steps to ensure data integrity, accuracy, and reliability.
Data analysis is an integral part of the research process. Before performing data analysis, researchers must ensure that numbers in their data are as accurate as possible.
Clicking the menus and buttons of statistical software applications like SPSS, Stata, SAS, Statistica, SOFA Statistics, Jasp, and even those in accessible statistical software applications in office productivity tools like MS Excel Analysis ToolPak, and the statistical function of open-source Gnumeric, among others, is easy.
However, if the data used in such automated data analysis is faulty, the results are nothing more than just plain rubbish. Garbage in, garbage out (GIGO).
For many students who want to comply with their thesis requirements, rigorous and critical data analysis is almost always given much less attention than the other parts of the thesis. At other times, data accuracy is deliberately compromised because findings are inconsistent with the expected results.
Data should be as accurate, truthful, or reliable as possible. If there are doubts about their collection, data analysis is compromised. Interpretation of results will be faulty that will lead to wrong conclusions.
In business, decision-making based on wrong conclusions can prove disastrous and costly. Hence, data analysts must ensure that they input accurate and reliable data into their data analytics tools as Tableau, Excel, R, and SAS.
How then can you make sure that your data is ready or suitable for data analysis?
Here are three essential elements to remember to ensure data integrity and accuracy. The following points focus primarily on data collection for both quantitative and qualitative types of research.
Five Essential Steps to Do Before Data Analysis

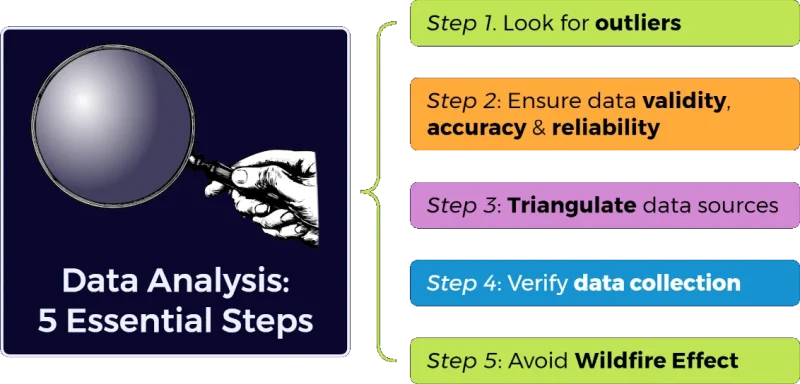
To maximize benefit from data obtained in the field, I recommend the following five essential steps to ensure data integrity, accuracy, and reliability. In fact, exploratory data analysis relies a lot on these steps.
1. Look for Outliers or Unnatural Deviations
As a researcher, make sure that whatever information you gather in the field can be depended upon. How will you be able to ensure that your data is good enough for analysis?
Be meticulous about overlooked items in data collection. When dealing with numbers, ensure that the results are within sensible limits. Omitting a zero here or adding a number there can compromise the accuracy of your data.

Watch out for outliers, or those data that seem out-of-bounds or at the extremes of the statistical measurement scales. Verify if the outlier is an original record of data collected during the interview. Outliers may be just typographical errors.
Data analysis and output are useless if you input the wrong data. Always check and recheck. Data review is a crucial element in data analysis.
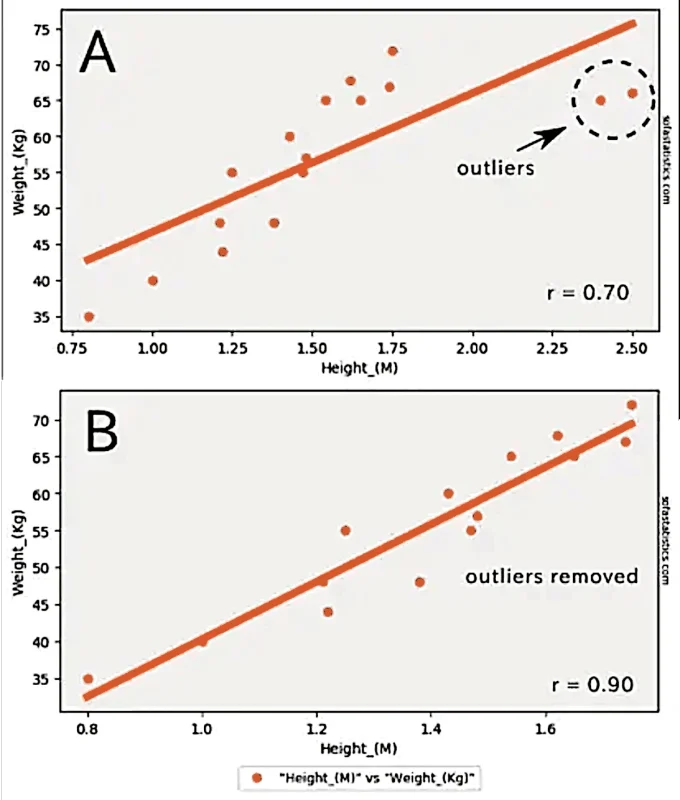
Presenting the data visually using a scatter graph when dealing with correlation studies or a histogram when inspecting the distribution of your data along a scale will help you spot outliers. Figure 1 shows the trendline and Pearson correlation coefficient value (r) with outliers (A) and without the outliers (B) in a correlation study of height and weight. Notice the big difference in their values. The outliers tend to pull the trendline (the thick orange line) towards the outliers giving a lower correlation value (r = 0.70 vs. r = 0.90).
2. Ensure Data Accuracy and Reliability
Do you know what the GIGO rule is? GIGO is an acronym for Garbage In, Garbage Out. This rule was popular in the early periods of computer use, where whatever you input into the computer is processed without question.
Data accuracy and reliability are indispensable requirements for doing excellent research. It’s because inaccurate and unreliable data lead to spurious or wrong conclusions. If you inadvertently input erroneous data into the computer, an output still comes out.
But of course, the results are erroneous because the data entered is faulty. Possibly, you input the data correctly, but then the data does not reflect what you want to measure.
Thus, it is always good practice to review whatever data you have before entering it into your computer through a software application like a spreadsheet or statistical software. Each item of data should be verified for accuracy and must be input meticulously.
Once entered, the data, again, must be reviewed for accuracy. An extra zero in whatever number you entered in a cell will affect the resulting graph or correlation analysis. Or data input into the wrong category can destroy data reliability.
This data verification strategy will work for quantitative data obtained mainly through standardized measurement scales, such as nominal or categorical, ordinal, interval, and ratio. The latter two measurements offer the most accurate measurement scales by which the data obtained will allow for sound statistical analysis.
Although measurement data will vary between observers, as some researchers apply a meticulous approach to what they are doing, while some do it casually, the measurement errors can be reduced to a certain degree. Data analysis may then be employed upon ensuring data accuracy and integrity.
In the case of qualitative research, which is highly subjective, there are also ways by which data can be verified or validated. I refer to a technique used in the social sciences called the triangulation method. The next section tackles this subject.
3. Triangulate sources of data
What is the triangulation method of sourcing data? How is it done?
Triangulation is one of the well-known research tools that social science researchers use to verify data accuracy. As the word connotes, it refers to the application of three approaches or methods to verify data.
Why three at the minimum?
The inherent subjectivity of data obtained through qualitative methods threatens data accuracy. If you rely on just a few subjective judgments regarding a particular issue, researcher bias results.
This idea works just like a global positioning system or GPS, where you need at least three satellites to tell you your exact location.
Simply put, this means that you need not only one source of information to provide answers to your questions.
At best, the questions you pose in qualitative research represent people’s viewpoints. These viewpoints should be verified through other means. If it so happened that you have only one source of information and that information is false, then that becomes 100% erroneous. Consequently, your conclusions are faulty. Having several information sources gives researchers confidence that the data they are getting approximates the truth.
Methods of triangulation in qualitative research
The most common methods used to demonstrate triangulation are the household interview or HHI, key informant interview (KII), and focus group discussion (FGD). These approaches can reduce errors and provide greater confidence to researchers employing qualitative approaches. They rely on the information provided by a population of respondents with a predetermined set of characteristics, knowledgeable individuals, and a multi-sectoral group, respectively.
HHI uses structured questionnaires administered by trained interviewers to randomly selected individuals, usually the household head as the household representative. It is a rapid approach to getting information from a subset of the population to describe the characteristics of the general population. The data obtained are mainly approximations and highly dependent on the honesty of the respondents.
Second, the KII approach obtains information from key informants. A key informant is someone who is well-familiar with issues and concerns besetting the community. Almost always, key informants are elders or someone who lived the longest in the place and is familiar with community dynamics or changes in the community through time.
The Washington’s Public Health Centers for Excellence explains in more detail the key informant interview process in the following video.
Third, FGD elicits responses from representatives of the different sectors of society. They are referred to as the stakeholders. They have a stake or are influenced by whatever issue or concern is in question. Fishers, for example, are affected by the establishment of protected areas in their traditional fishing grounds.
4. Verify the manner of data collection
Cross-examine the data collector. If you asked somebody to gather data for you, ask that person some questions to determine if the data collection was systematic or truthful. For paid enumerators, there is a tendency to administer questionnaires in their haste to meet a set quota of questionnaires to be filled out during the day.

Some enumerators have a nasty way of gathering two or three respondents together to conduct the interview. Interviewing in this manner can affect the results. A participant will most likely influence another participant in the simultaneous interview.
If you, as a lead researcher, notice this tendency, it would be best to call the attention of the enumerators. Chances are, they will miss filling out the required answers. They may fill out the missing items themselves that would affect the credibility of the data. The information gathered should be cross-checked to prevent this from happening.
To ensure data quality, you may ask the following questions:
- How much time did you spend interviewing the respondent of the study?
- Is the respondent alone or with a group of people when you did the interview?
To reduce cheating in the interview, asking your enumerators to have the interviewees sign the transcript right after the session will help. Ask the enumerators to write about how long the interview took, noting the start and end times. A picture taken by a third person of the one-on-one engagement would help.
5. Avoid biased results: the Wildfire Effect
Watch out for the so-called “wildfire effect” in data gathering. The wildfire effect is analogous to someone lighting a match and igniting dry grass leaves that cause an uncontrollable forest fire. This situation demonstrates the power of the tongue. Gossipers magnify wrong information and eventually cause harm due to misunderstanding or distorted information through the grapevine. Hence, the term wildfire effect.
Wildfire effect happens when you are dealing with sensitive issues like fisherfolk’s compliance to ordinances, rules and regulations or laws of the land. Rumors on the issues raised by the interviewer during the interview will prevent other people from answering the questionnaire. Respondents may become apprehensive if answers to questions intrude into their privacy or threaten them in some way.
Thus, questionnaire administration must be done simultaneously within, say, a day in a group of interviewees in a particular place. If some respondents were interviewed the next day, chances are they have already gossiped among themselves and become wary of someone asking them about sensitive issues that may incriminate them.
There are many other sources of bias that impact negatively on data quality. These are described in greater detail in another post titled How to Reduce Researcher Bias in Social Research.
Adhering to good practices espoused in this article will ensure reliable data analysis. Hence, you will contribute meaningfully to the body of knowledge and avoid feeling guilty that you missed or did something inappropriate that led to misleading conclusions.
FAQ: Data Analysis: Five Essential Steps
Q1: Why is data quality important in data analysis?
Data quality is crucial because faulty data leads to inaccurate analysis results, summed up by the phrase “Garbage In, Garbage Out” (GIGO). Reliable data ensures accurate interpretations and conclusions.
Q2: What are the five essential steps before data analysis?
The steps are:
- Look for outliers or unnatural deviations.
- Ensure data accuracy and reliability.
- Triangulate sources of data.
- Verify the manner of data collection.
- Avoid biased results, known as the Wildfire Effect.
Q3: What is the significance of detecting outliers?
Detecting outliers helps verify if the data can be depended upon. Outliers might indicate errors or unusual data points, and checking them is essential to ensure accuracy.
Q4: How does triangulation improve data accuracy in qualitative research?
Triangulation applies multiple methods to verify data accuracy, reducing researcher bias and subjectivity, similar to how GPS uses satellites for precise location.
Q5: How can one verify the method of data collection?
Verify by questioning the data collectors about their process, ensuring they conducted systematic and unbiased interviews, and being cautious of any group interviews that might skew results.
Q6: What is the Wildfire Effect and how can it be avoided?
The Wildfire Effect refers to the spread of misinformation among respondents, leading to biased data. It can be avoided by administering surveys simultaneously to prevent gossip and influence.


